Emile VD Heyde

Curious Problem Solver | Data Analyst | Data Science Enthusiast | Python Lover
View My LinkedIn Profile
View My Curriculum Vitae
Covid-19 Power Bi Visualisations
Project Description:
This project uses a GitHub Repository with daily data on Covid-19. The Repository is copied and synced on my local drive. The data is imported and uses Power BI to restructure tables. DAX is used to structure the data for analysis. And finally, the information is displayed in interactive graphs and animation graphs.
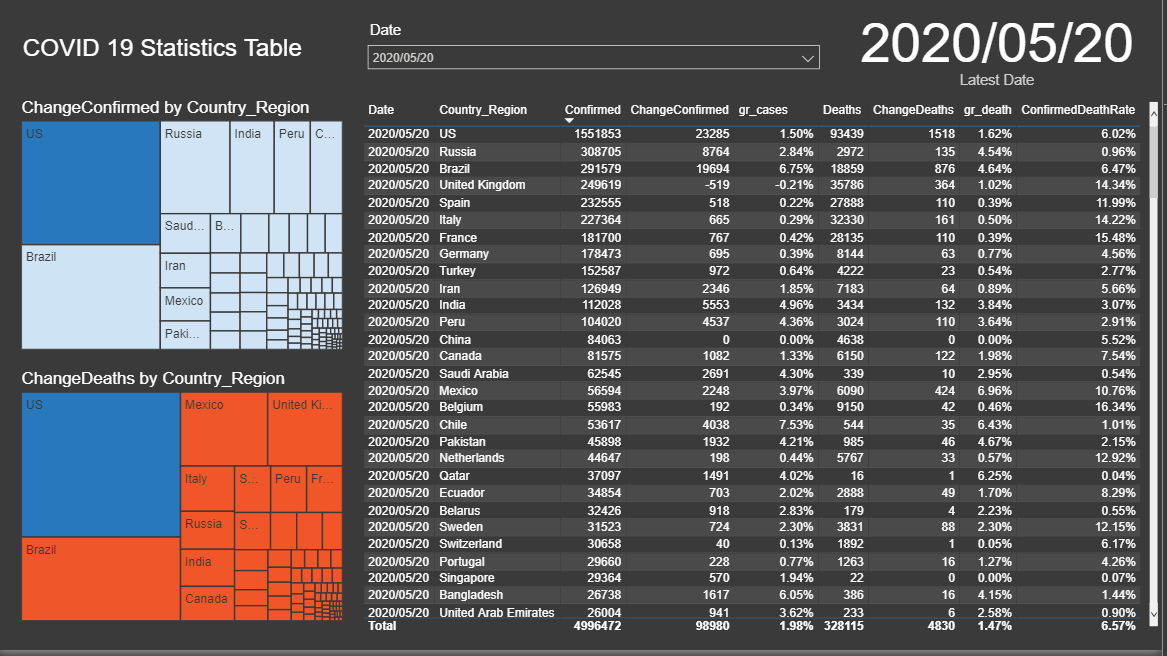
1. Tabulation Daily
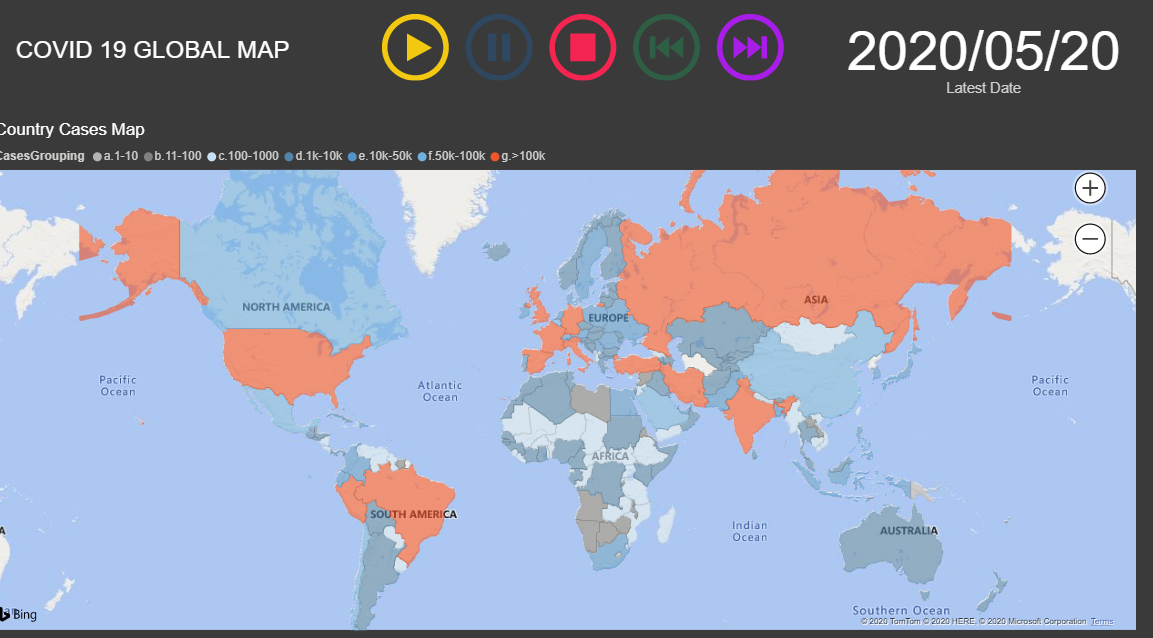
2. Global Map
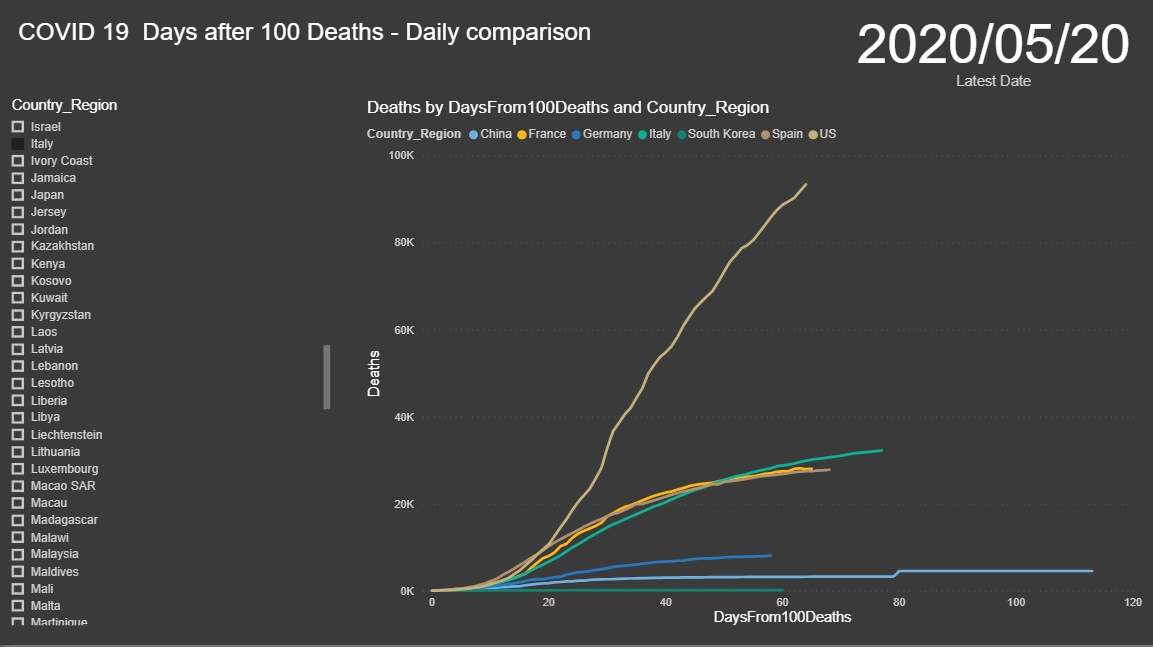
3. Country Comparison
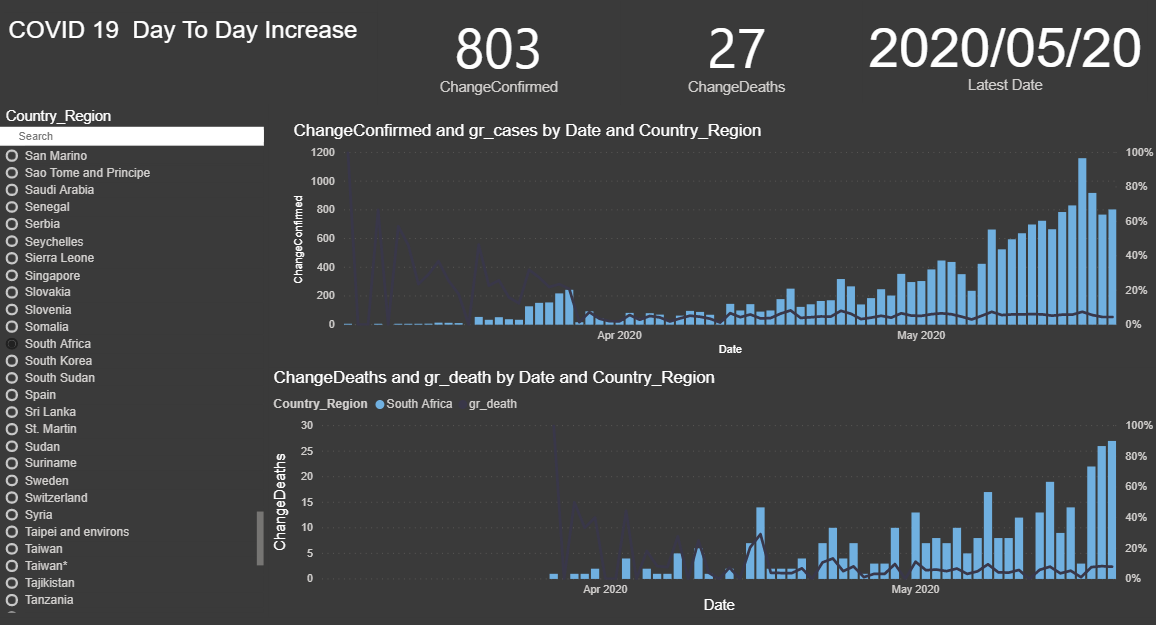
4. Daily changes For South Africa
Data Sourced from John Hopkins Github
Technology used : Power BI | GitHub